Key Takeaway: The Common Data Set (CDS) initiative is a collaboration of schools, publishers, and the higher education community to publish data relevant to college students, application processes, financial aid, and more. Common Data Set can provide insight into acceptance rates, SAT/ACT scores, college costs, and factors that can influence a student’s decision on whether or not a school is right for them.
What is The Common Data Set?
As described on the Common Data Set website, the CDS initiative
“is a collaborative effort among data providers in the higher education community and publishers as represented by the College Board, Peterson’s, and U.S. News & World Report. The combined goal of this collaboration is to improve the quality and accuracy of information provided to all involved in a student’s transition into higher education, as well as to reduce the reporting burden on data providers.”
Colleges and universities that participate in the CDS initiative use standardized forms provided by the organization to highlight their various data points. These are often published on the colleges’ website rather than a centralized location. Many participants release their reports annually. However, not all schools publish their Common Data Set or participate in it every year.
Participating in the CDS initiative standardizes college data, increases overall transparency, and improves data accessibility as the reports are public and free. Thanks to this information, students can make more informed decisions about their future education.
What Schools Participate in the Common Data Set?
Hundreds of colleges, universities, and institutions in the United States have participated in the Common Data Set over the years. Some schools participate every year, while others only publish their information or participate intermittently.
Schools’ Common Data Sets are not released in one centralized location, but rather on the schools’ individual websites. You can find reports by using a search engine. For example, you can find NYU’s reports by searching for “NYU Common Data Set.”
Keep in mind that some schools do tweak the standard Common Data Set layout to fit their brand, simplify data, or explain policies. Some sections will have slightly different layouts at various colleges as a result.

What Information is Covered In the Common Data Set?
All schools’ Common Data Set reports cover the same information in a standardized format. This format has changed over the years, so you may see slightly different data points, details, or layouts in older reports. These reports can be over 30 pages long, so it’s a lot to cover.
The amount of detail a school goes into is completely up to the institution. Some may not complete specific sections of the report. Definitions of various phrases and terms can be found at the bottom of the CDS form.
For 2023-24 reports, the data is organized into these sections:
General Information
This section covers basic information for the school, including:
- Address
- Contact information
- Institution classification
- Academic year calendar
- Degrees offered
Enrollment and Persistence
The Enrollment and Persistence section is split into different parts:
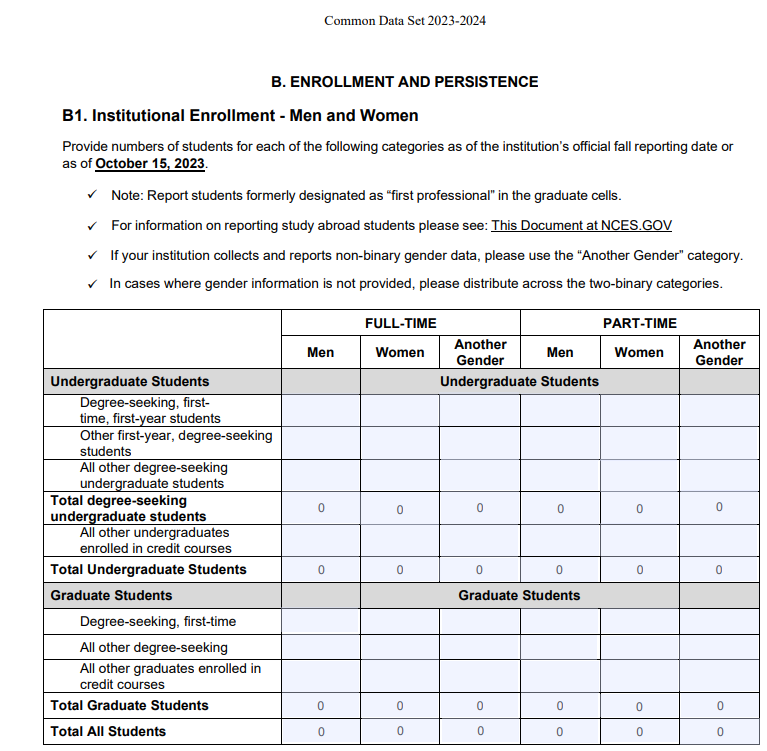
- Institutional Enrollment – Men and Women
- This shows how many total students, including undergraduate and graduates, the school had during the school year. It breaks down how many men and women are attending, how many are attending full time vs part time, and how many are degree-seeking vs. enrolled in credit courses.
- Enrollment by Racial/Ethnic Category
- This section breaks down how many students are of different races and ethnicities, or are considered international, nonresident students.
- Number of degrees awarded
- The section includes how many bachelor’s, post bachelor’s, master’s, post-master’s, and doctoral degrees (research/scholarship, professional practice, and other) during an academic year.
- Graduation Rates
- The Graduation Rates portion details how many students graduated in four, five, or six years and how many received a Pell Grant or a subsidized Stafford Loan and graduated, and the six year graduation rates.
- Retention Rates
- This percentage shows how many full-time, bachelor’s students stayed enrolled after they completed their first year that year.
First-Time, First-Year Admission
This portion only accounts for first-year, first-time students, also known as freshmen. It’s separated into several different subsections, and covers a lot of data that can be particularly helpful for students looking to increase their acceptance chances to a particular school.
The first part covers applications, and breaks down the numbers into men, women, and total. The data showcases:
- Total number of applications
- Number of students admitted
- Number of accepted students who enrolled full-time
- Number of accepted students who enrolled part-time
The second portion is about wait-listed students, and highlights:
- Whether the school has a waiting list
- Number of students placed on the waiting list
- Number of students who accepted a place on the waiting list
- Number of wait-listed students who were admitted
- If the waiting list is ranked, and if so, if that information is released to students and school counselors
- Ranked, or ordered, means if a spot becomes available for a student, the offer goes to the next student on the ranked list. If that student passes, the spot goes to the next student.
The next portion reviews the schools’ admission requirements. It details what is needed to be admitted to the college, such as the number of required or recommended high school academic credits, diploma and or GED, and college-preparatory programs.
And the following subsections cover admission and acceptance policies. It explains whether the school has an open admission policy, meaning it accepts nearly all students who apply. It also shows the importance of different academic and nonacademic factors that matter for admission decisions. Schools also need to provide additional information if different factors matter for different programs.
Schools rate how each of the following selection criteria are considered on a scale of “very important,” “important”, “considered” or “not considered”:
Academic Categories:
- Rigor of secondary school record
- Class rank
- Academic GPA
- Standardized test scores
- Application essay
- Recommendations
Nonacademic Categories:
- Interview
- Extracurricular activities
- Talent/ability
- Character/personal qualities
- First generation
- Alumni/ae relation
- Geographical residence
- State residency
- Religious affiliation/commitment
- Volunteer work
- Work experience
- Level of application interest
For example, Carnegie Mellon University’s Common Data Set for 2023-2024 for their Pittsburg Campus considers rigor of secondary school record, class rank, academic GPA, extracurricular activities, character/personal qualities, and volunteering the most important out of all the factors. Meanwhile, they don’t conduct an interview, and alumni/ae relation, state residency, religious affiliation, and level of applicant interest don’t impact acceptance chances. Some schools, such as Harvard, may simply just put “considered” or “not considered” for this section.
The next subsections are on SAT and ACT policies. They review:
- Whether the SAT, ACT, ACT essay, and/or SAT Subject Tests impact admission decisions
- Whether or not the standardized tests are required, recommended, or not considered. Carnegie Mellon University doesn’t require the SAT or ACT, but does consider it if it’s submitted. They don’t require the ACT essay.
- SAT/ACT/SAT Subject tests score submission deadlines.
- Which tests are used for placement, including AP tests, CLEP, and institutional exams
- Percent and number of students who submitted SAT and ACT scores
- 25th, 50th, and 75th percentiles on the SAT and ACT, and ranges of scores
The remaining subsections cover:
- High school class ranks
- GPA ranges and average
- Application fees and waivers
- Application closing dates and priority dates
- Important admission dates, including acceptance letter deadlines, reply policies, and housing deposit deadline
- Early decision and early action policies, deadlines, and number of applications received under these admission plans
Transfer Admission
Colleges often have different admission requirements for transfer students. This subsection covers that, and schools answer questions on:
- Number of students who applied, were accepted, and enrolled as transfer students
- When transfer students may enroll
- The minimum of credits required to transfer, and the maximum and minimum amounts of credits required to earn degrees at the school
- Required items for applications, including GPA
- Deadlines and dates for applications
- Admission policies and other transfer credit policies, including military/veteran transfer credit policies
Academic Offerings and Policies
Academic Offerings and Policies gives schools an opportunity to list programs available. Some examples of these programs include accelerated programs, double majors, honors programs, internships, study abroad opportunities, and undergraduate research. It also details the areas where most or all students must complete some course work before graduation. For example, Carnegie Mellon University requires students to complete some courses in computer literacy.
Student Life
The Student Life subsection provides percentages on first-year and undergraduate students, including percent of students who:
- Are from out of state
- Join fraternities or sororities
- Life in college owned housing or off campus
- Are 25 or older
It also goes into average ages of students, activities and programs offered, and available housing. For instance, some available programs at Carnegie Mellon University include Naval ROTC, drama, marching band, yearbook, radio station, and student newspaper, among others.
Annual Expenses
The Annual Expenses section covers everything undergraduate, full-time students need to know about the cost of attending college. It goes beyond tuition, fees, credit hours, and room and board costs, too. The school can estimate expenses for books and supplies, room only, transportation, and other potential costs for campus residents and commuters. There also may be a link to net price calculators.
Financial Aid
This portion of the CDS report covers aid awarded to undergraduates. It details
- How the institution awards aid, available types of aid, and criteria used for institutional aid
- How much money students received in financial aid, including institutional aid, federal aid, state aid, other scholarship sources, loans, work study, athletic awards, and tuition waivers
- How many students received financial aid per source, and average financial aid packages or borrower amounts for each source
- Required financial aid forms, such as the Free Application for Federal Student Aid (FAFSA) and deadlines for these forms
- Financial aid notification and reply dates
Institutional Faculty and Class Size
This data can give students insight into student-to-faculty ratios and potential class sizes for various programs. It also provides information on diversity among faculty, number of faculty with doctorates and master’s, and undergraduate class sizes.
Disciplinary Areas of Degrees Conferred
This portion of the CDS reviews different major programs, and the percentages of diplomas, certificates, associate degrees, and bachelor’s degrees awarded in the previous year.
Why Should You Pay Attention to This Data?
The data provided in schools’ Common Data Sets can be overwhelming, but there’s a lot of fantastic information in them. Students can learn a lot about application policies, financial aid programs, and more. Here are some benefits and reasons you’ll want to check out schools’ CDS reports.
You Can Gain Insight Into Acceptance Rates
Every school has different acceptance rates. Some are highly selective, while others accept almost all that apply. While these numbers can provide some information on how hard (or easy) it is to get into a specific institution, it doesn’t really explain why those students were accepted.
Harvard University, for example, had a 3% acceptance rate for the 2023 admissions cycle. Their CDS file details facts about their enrolled students for the 2023-24 academic year, including average SAT and ACT scores, class rank ranges, GPA ranges, and average high school GPA. Here’s some of the data that’s shown in Harvard’s CDS report:
- 75th Percentile Score for SAT Math: 800
- 75th Percentile Score for ACT Composite: 36
- Score Ranges for SAT Math: 94% earned between a 700 and 900
- Percent in top tenth of high school graduating class: 40%
- Percent of students who had GPA of 4.0 or higher in high school: 02%
- Average High School GPA: 2%
These data points put that 3% acceptance rate into perspective for students, and they can clearly see why the acceptance rate is so low.
They Help You Round Out Your Application
The Common Data Set also helps students identify exactly what the college is looking for in their students beyond the grades and standardized test scores. One portion of the “First-Time, First-Year Admission” section reviews the importance or non-importance of various academic and non-academic factors for admission to a particular college. Students can know right off the bat if the school has an interview or not thanks to this information. And while Harvard does highlight the data for class ranks in their CDS report, they actually state that this factor is “not considered” for admission decisions.
The CDS also gives transfer students a leg up. Thanks to these reports, transfer students can better understand GPA requirements, transfer policies, admission deadlines, and more.
All of this information can help students create a game plan for their applications. They’ll know the exact points in their applications that need more attention than others. And students interested in a particular school years in advance can start focusing on the important factors for admission ahead of time.
Many colleges are looking for the same things in students, but these sections highlight what’s most important to admission officers. One aspect to pay attention to is “demonstrated interest.” Not all colleges consider this important, but other schools may consider it “very important.” If your potential school considers it important or very important, you’re going to want to take steps early to demonstrate your interest in the college. If you didn’t look up this data on the CDS, you might not know how vital it is and could miss out on an acceptance letter as a result!
You Can Better Understand College Expenses
Paying for college can be scary. Even if you know the sticker price of a college and completed the FAFSA, it’s a lot of information. The CDS breaks down expenses, financial aid, and other relevant data into bite size pieces that show exactly how much the average student receives in loans, institutional grants, and other similar packages. Even before you receive a financial aid award letter, you can understand more about what the school has to offer in merit scholarships, need-based aid, work study, and athletic scholarships.
Many schools also provide a breakdown of estimated expenses to help you better budget beyond tuition. In addition, by knowing how much the average student takes in loans, you can better compare financial aid offer letters, plan for your financial future, and make informed decisions about your finances for today and the years to come.
You Can Learn More About a College’s Offerings
The CDS provides students insight into available programs and activities. If fraternities and sororities are important to you, for instance, these reports highlight the number of undergraduates participating in them – you’ll be able to know right off the bat how big of a deal Greek life is on campus. If drama is a must have extracurricular at your future college, the CDS states whether or not the school offers it. While you can go to the schools’ websites to find this information, the CDS reports make it easy to compare your options.
The housing portions of the CDS explain the various housing available to undergraduates. While some may simply offer coed dorms, men’s dorms, and women’s dorms, others might have apartments for single students, wellness housing, special housing for disabled students, living learning communities, and more. If you need something extra out of dorm life, you can compare the offerings between different institutions.
However, where the CDS falls short is sports. It covers athletic scholarship opportunities, but the standard form doesn’t go into athletic options on campuses. You’re going to have to go to the school’s website for more information.
Common Data Set and Other Tools
By reviewing institutions’ Common Data Sets, you can gain valuable insight into what makes a school unique, what they’re looking for in a student, how much it will cost to attend, and how you can improve your chances of receiving an acceptance letter. If your potential schools publish their CDS files, it’s highly recommended you check them out and use them to compare your options before you start applying to colleges!
Another way students can compare schools is with College Raptor’s College Match Tool. College Match aggregates pertinent admissions data directly from IPeds Data Center. Then, once a student registers for an account and starts building their college list, College Match highlights all the schools on their list and compares acceptances odds and probable costs based on profile information provided (much of like what’s asked on the CDS from).
Use College Match today for free to start finding schools that match you.