Flickr user Penn State
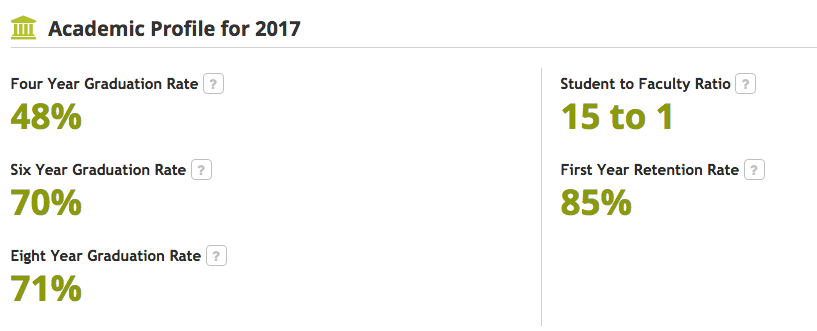
The academics tab for a school gives more information about class size, graduation rates, and what the student body population looks like. The first-year retention rate shows the percent of freshmen that stay at Iowa beyond their first year. This can help indicate whether or not students feel comfortable on campus.
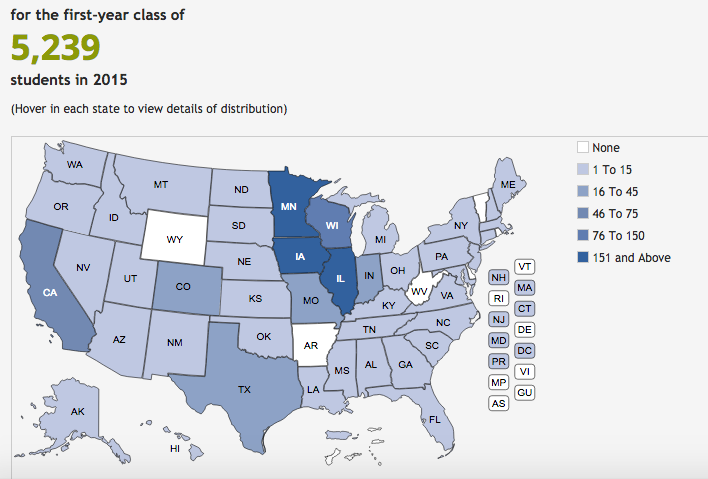
The next section highlights where the previous incoming class is from across the United States. You can scroll over states to see the number of students that come from there. You can also see what percentage of the incoming class they make up. Seeing this can help you visualize where your potential classmates might be coming from, and if the campus appears to have a lot of out-of-state students or mostly in-state.
Beyond that, we have more detailed information regarding the breakdown of the total student population. The first donut chart looks at the race and ethnicity of the entire student body. If you are looking for a diverse school, this will be one of your key indicators to look into. The second donut chart displays the total enrollment at the school by age group. It is common for students to be from a variety of age groups, as you can see in the chart included from the University of Iowa. This section also include information on other learning opportunities. These may include distance learning, ROTC, study abroad, and more.
The last portion of this page lists the accreditation status of various campuses or degrees offered at the institution. Have you used our college match tool yet? If so, check out the academics tab for each of your favorite colleges to get a better look at what the student population looks like!


