Source: Flickr user albertogp123.
The answer to “What is a good SAT score?” isn’t always straightforward. There is no single answer; it depends on what you mean and your own goals!
One way to define “good” is to see how your score compares to your peers and other students at the colleges you’re hoping to attend. Many schools will be looking for specific SAT (or ACT) scores from their applicants and having a “good” score will help improve your chances.
Another way to define “good” is to consider your own goals. Are you hoping to score higher than other students or hoping to come in somewhere near average? Or do you just want to know what your odds of acceptance are at a specific college with your current 1400 SAT score?
What Is a Good Sat Score?
Whatever a “good” SAT score means to you, there are some numbers that you can use as a benchmark to see if you’ve met your goals. Because, ultimately, what matters is that you’re happy with the score you’ve received.
First, it’s important to note how the SAT is scored. The exam consists of a Math section and a Reading/Writing section. Each is graded between 200 and 800. These are then combined to create the SAT Combined score. 1600 is the highest possible score, with 400 as the lowest score.
Students should also know that some schools no longer require the SAT (or ACT) as part of their admissions department. However, it’s still a good idea to sit for the exam even if the colleges on your list are test-optional schools. You never know if another college will catch your eye late into the admissions cycle and require it!
SAT Score Requirements
Most schools don’t publish a “required” SAT score for admission. Instead, students can look at the scores of other students who have been admitted to see how selective the college is.
Generally, these figures are reported as a distribution of the 25th and 75th percentile of the SAT scores of admitted students. In other words, it gives you a way to determine, roughly, what an “average” score might look like for students at that college. It’s also important to note that many schools are no longer looking at an ACT or SAT requirement, so consider that as well.
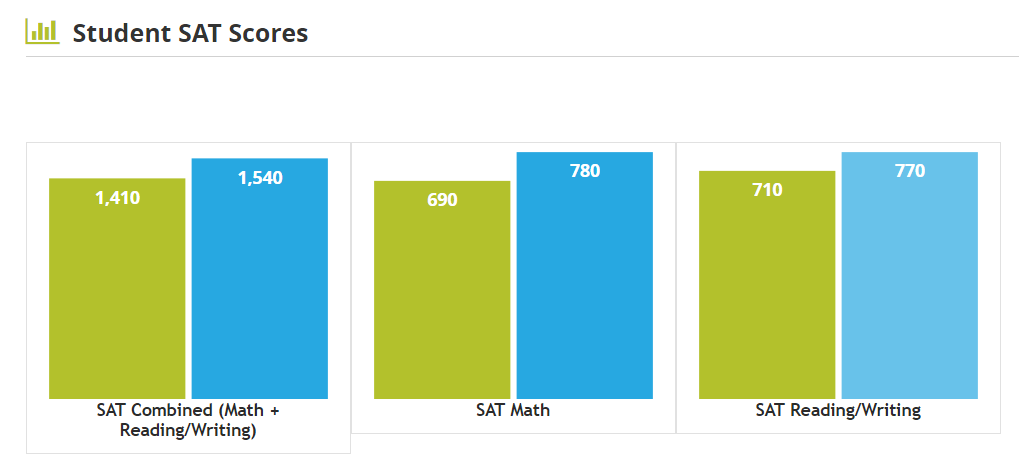
Each school on College Raptor displays the 25th and 75th percentiles of SAT scores for admitted students. For example, the Swarthmore College admissions page contains this graph:

As a student, you can see how your SAT score stacks up against other students at this college by seeing where you fall in this distribution. If you’re near the middle of this range (median SAT), then you can expect about an average chance of being admitted. In this example, if a student has an SAT Combined score of 1,540, they can expect about a 75% chance to be admitted.
If you want to increase your chances of getting into your dream school or target school, it’s important to pay attention to these numbers and aim for them when it comes to your test date! Preparation and study are key.
However, your chances of admission will, of course, also be based on the rest of your application. Things like extracurricular activities, volunteer work, recommendation letters, GPA, the rigor of your class schedule, and more will play a role in whether or not you’re accepted. It’s not just about your SAT scores!
Merit Aid and SAT Scores
Your SAT score can be worth a lot – literally.
Beyond just looking better on your college applications, higher test scores can mean that you qualify for more scholarships. Many colleges offer specific merit awards based on academic achievement. So, improving your score could mean that you earn thousands of dollars in financial aid from some colleges.
It’s worth investigating. Check out college websites or talk to their admissions or financial aid office to see which scholarships you might be eligible for based on your SAT score.
SAT Score Distribution
Want to just know how your SAT score compares to all other students? Then you’ll want to look at the distribution of SAT scores. Luckily, College Board publishes these every year to help students understand how they scored.
Here’s the distribution of SAT scores from 2021:
| SAT Composite Score Range | Percentile Score |
| 1550-1600 | 99 to 99+ |
| 1500-1550 | 98 to 99 |
| 1450-1500 | 96 to 98 |
| 1400-1450 | 93 to 96 |
| 1350-1400 | 90 to 93 |
| 1300-1350 | 86 to 90 |
| 1250-1300 | 81 to 86 |
| 1200-1250 | 74 to 81 |
| 1150-1200 | 67 to 74 |
| 1100-1150 | 59 to 67 |
| 1050-1100 | 51 to 59 |
| 1000-1050 | 42 to 51 |
| 950-1000 | 34 to 42 |
| 900-950 | 26 to 34 |
| 850-900 | 19 to 26 |
| 800-850 | 12 to 19 |
| 750-800 | 7 to 12 |
| 700-750 | 3 to 7 |
| 650-700 | 1 to 3 |
| 600-650 | 1- to 1 |
| 550-600 | 1- |
| 500-550 | 1- |
| 450-500 | 1- |
| 400-450 | 1- |
As you can see from this table, the 50th percentile falls around 1050 out of 1600–the median score.
On tests like the SAT, the median score is generally considered to represent an “average”, although it’s not the mean score.
Check out how your SAT score affects your acceptance odds with College Raptor! And make sure to use our College Match tool to see schools that would be a strong bet for acceptance based on your score.


